
Authors: Zoltán Szenek, Donát Szám
Facts and Myths About Precision Agriculture – Part 1
Many farmers have spent money on precision tools, but they feel they are not getting the results they wanted. The problem is usually not the technology itself. The real challenge is to understand and use the data. In this article, we will show you the common myths and mistakes. If you avoid them, your work with precision farming can finally become more profitable.
Myth 1: NDVI is a perfect tool for everything. You can use it to create zones, plan applications, and yield prediction.
Reality: NDVI is not the right tool for these. You can only use it for a very limited way, and you must be very careful.
Since the Sentinel satellites were launched in 2015, a very large amount of data is now available for farming. You can get calibrated satellite pictures from past years, and you can download and analyze them for free. Because this data is free, farmers think they can use it instead of real yield data. The most common satellite index is NDVI. NDVI is a good tool for a quick, visual check of a plant’s health. It helps find stressed areas and see differences in biomass. So, it seems useful for making quick decisions. But is it good for long-term planning?
In our work, we have always found that NDVI by itself is not a good tool for planning zones and application rates. Now, we will show you why this is true.
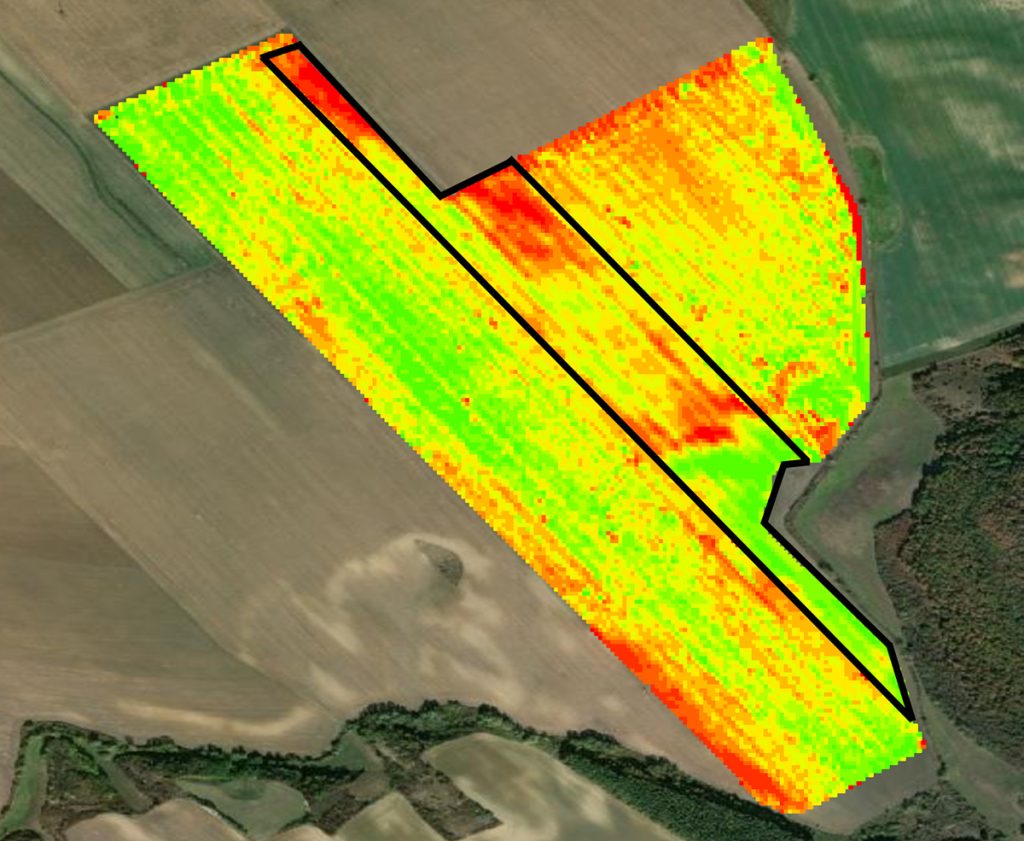
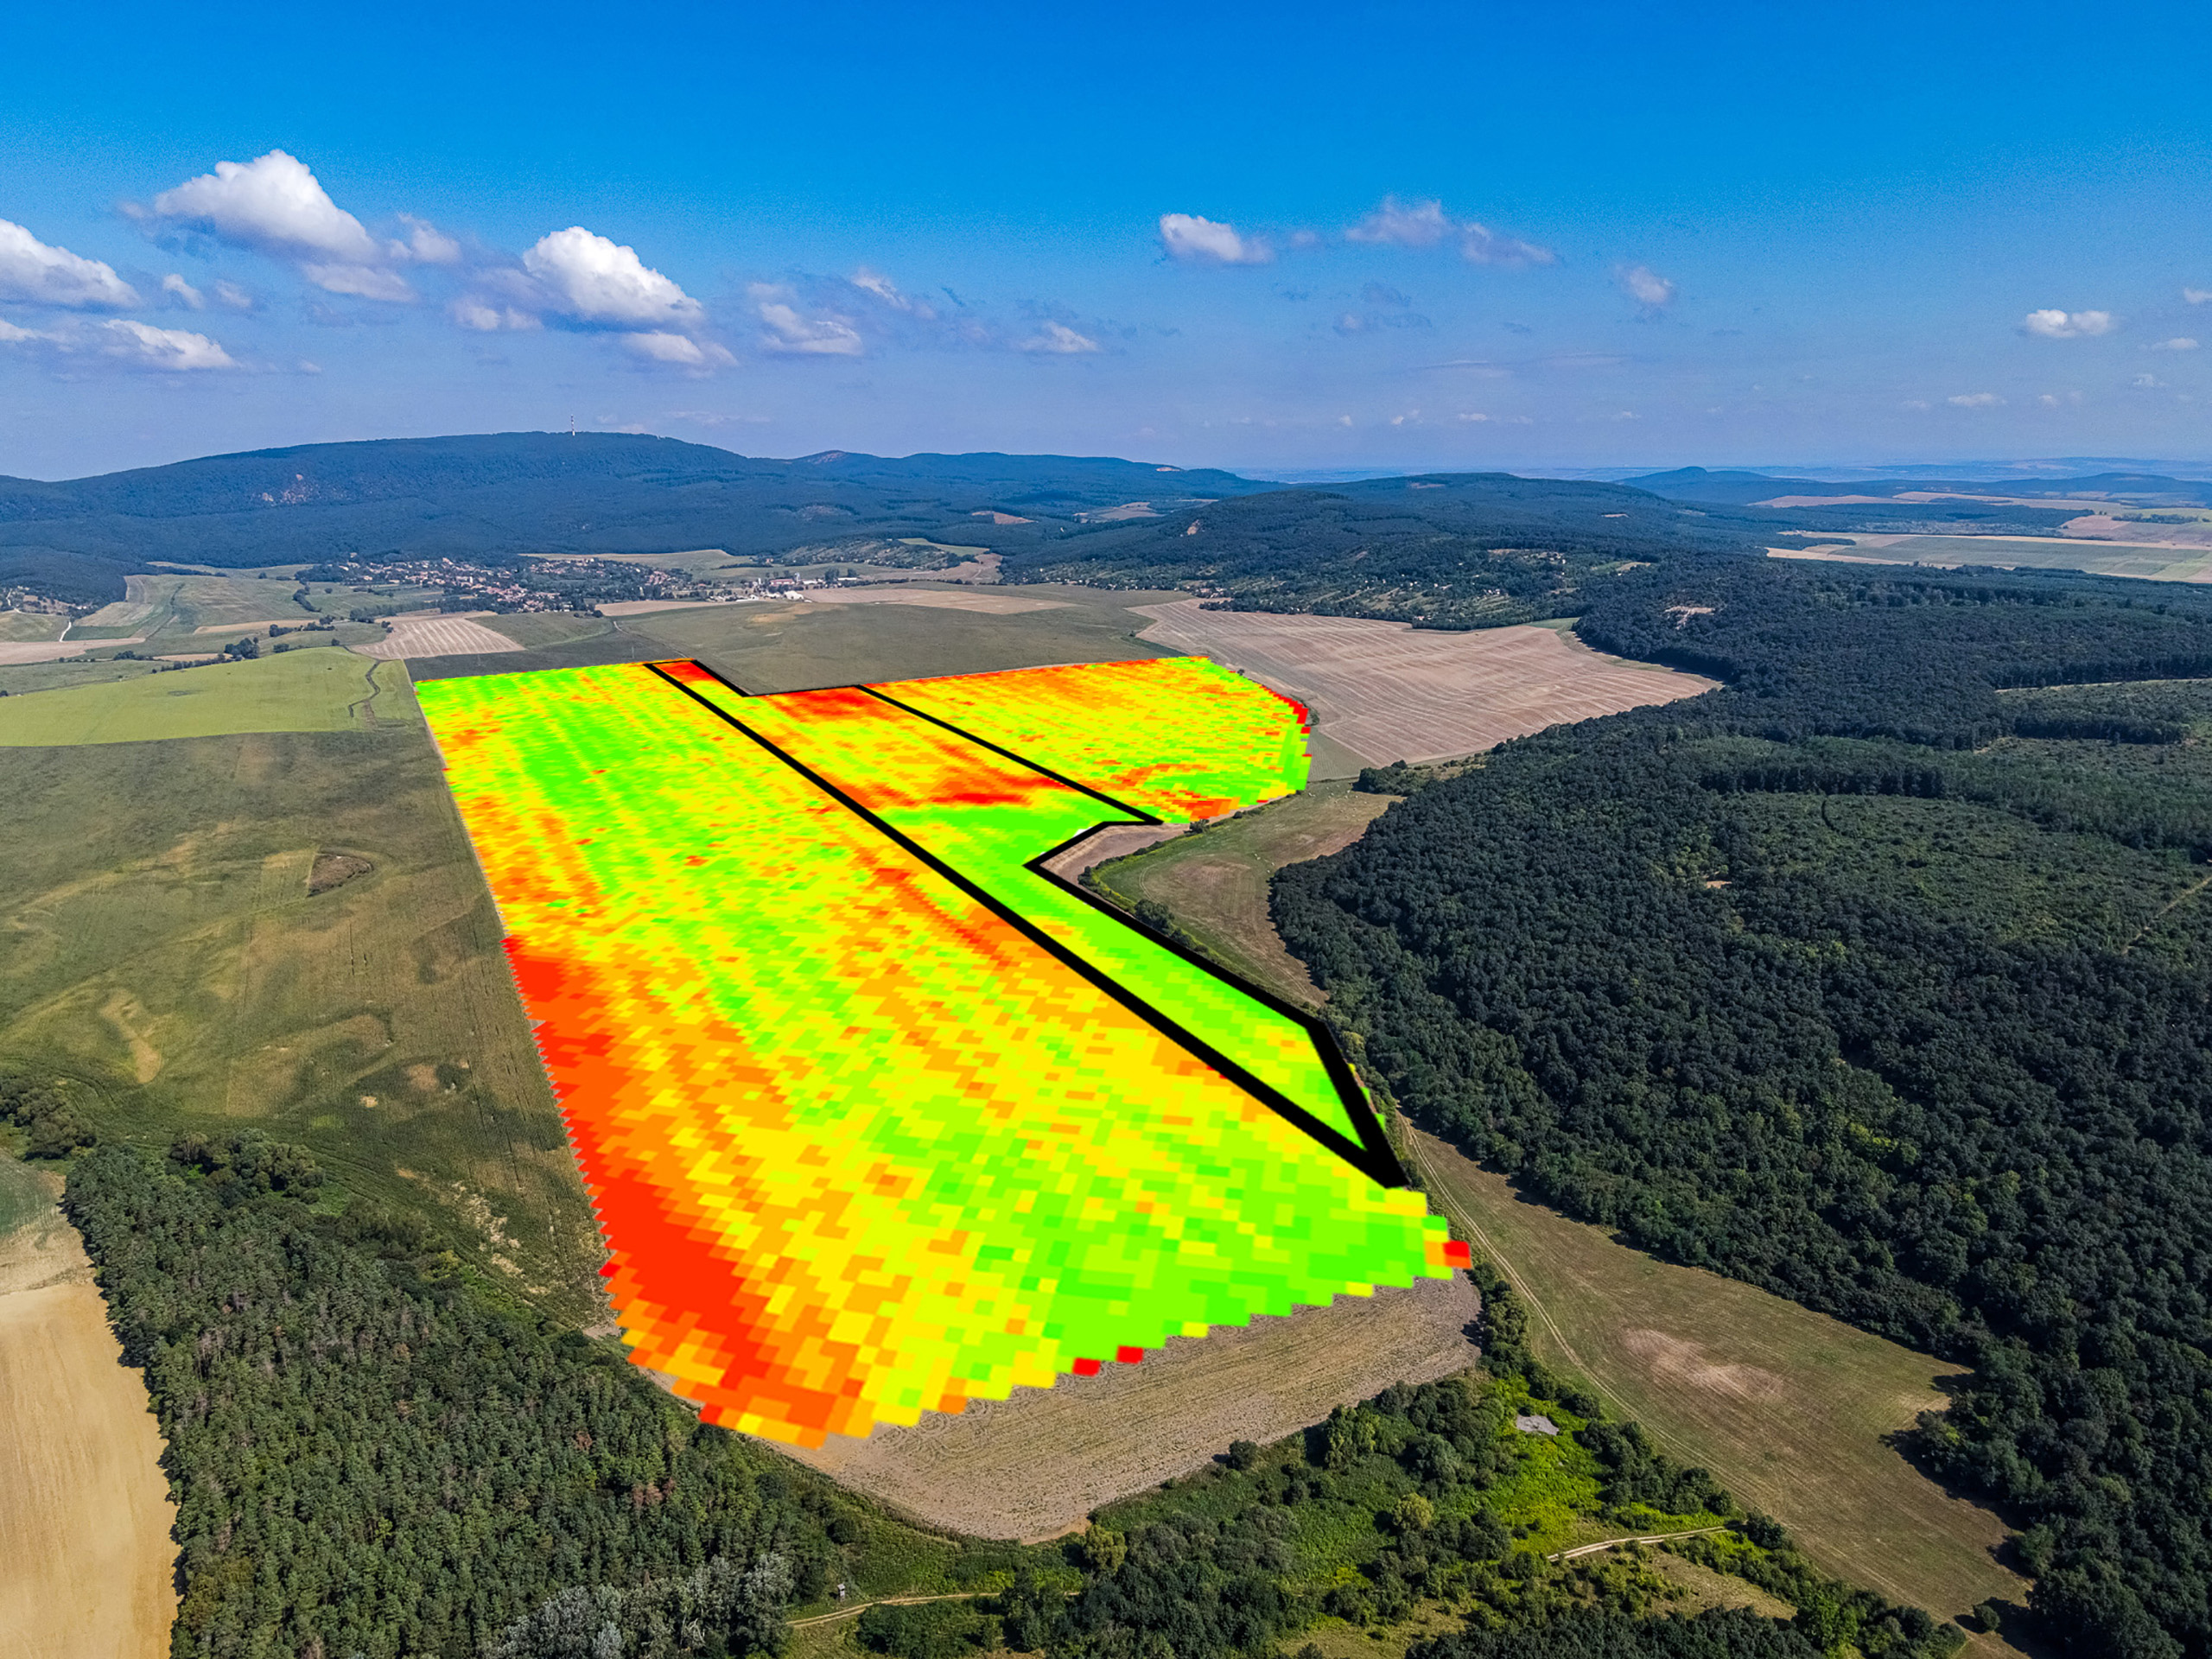
In one of our projects, a harvester had an error and did not record yield data for one strip of a field. So, we used NDVI data from the Sentinel satellite to fill in the missing information. Our method was to create a special mathematical equation just for this field. This equation described the connection between the real yield data and the NDVI values. Then, we used it to estimate the yield in the missing strip. On the picture, the area inside the black polygon shows the yield that we calculated from the NDVI data. This shows an important rule: You can only estimate yield from NDVI if you also have some real, calibrated yield data from the same field, for the same year and crop. Without real data to compare, the NDVI estimates will be wrong. But even with this careful method, the results are not perfect. In the south-east (SE) part of the strip, the NDVI data suggests a high yield, but this is actually the weakest zone. In the north-west (NW) part, the NDVI data suggests a low yield, but these are some of the best areas of the field. Let’s look at this in more detail.
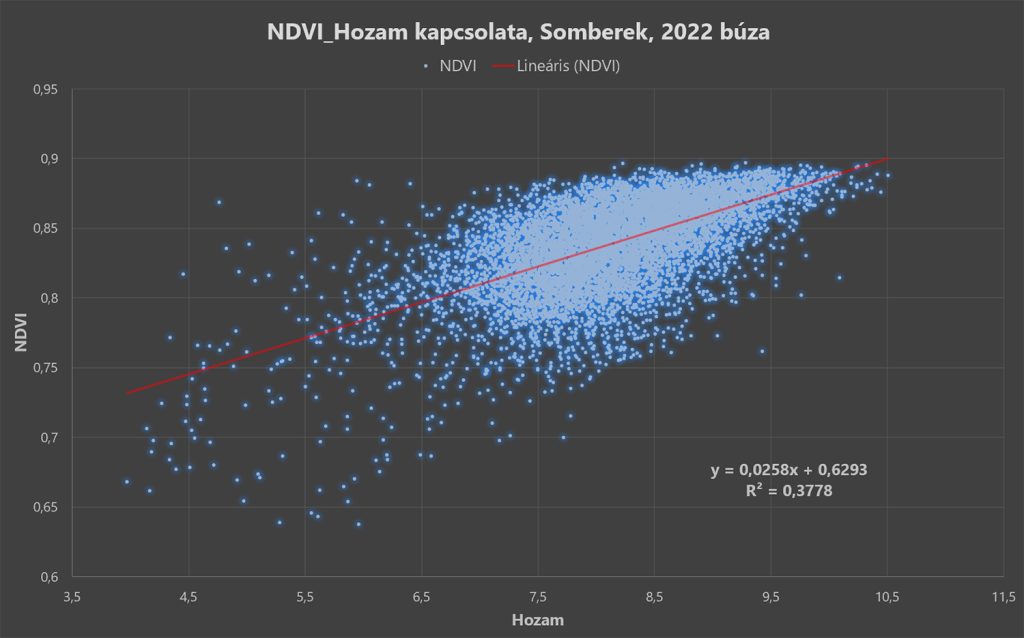
In our study, we divided the 134-hectare field into 18 754 small cells (each 10×10 meters). For every cell, we measured the average yield and the NDVI value also. We checked the connection and correlation, between the NDVI values and the yield. The correlation coefficient (or R² value) was 0.38. On another similar field, this value was only 0.22. These numbers show a medium-week and week connection between the data. For good planning, the R² value should be above 0.8. The perfect connection is 1. We also saw that many cells with high NDVI values have a low yield. The opposite is also true.
All of this shows one thing very clearly: you cannot accurately estimate yield by only using NDVI values. You also can not create correct management zones just by averaging NDVI data from many years. And finally, you cannot plan your fertilizer application rates based only on this information.
Myth 2: Precision farming is only profitable for big farms.
Reality: Believe it or not, based on our own experience, it already works on farms as small as 200 hectares!
The profitability of precision farming does not depend on the size of your farm. It depends on good planning. You can start small. It is profitable even if you only do variable rate seeding, or just apply fertilizer with a variable rate method. And no, you do not need the newest, most expensive machines for this. We will talk more about that later.
We often visit farms and see that they already own various kind of precision tools. This could be a precision seeder, or a sprayer that can do Variable Rate Application. But when these farmers tried to use the tools, their plans often failed. Because of this, they lost trust in precision methods. For many farmers, “precision farming” is now a bad word. But believe us, it does work. To make it work, you need agricultural-digitalization engineers, because every step needs careful planning. We have seen many different ‘user-friendly’ hungarian softwares for creating plans. We can say for sure that simple softwares is a big reason why variable rate methods often fail in Hungary. So, how can you make it work?
We wrote about this before. You can read about it in our post: Going Beyond Precision Agriculture (3.0) – Duo Sense.
Myth 3: You can only do precision agriculture with the newest, most expensive machines.
Reality: The age of the machine is not important. The main thing is that it must be able to do Variable Rate Application.
You do not need to buy the newest machines to start with this. This is because it is not the future; it is happening now. If you have a machine that can do Variable Rate Application, or if you can upgrade an older machine to do it, you are ready to begin! We can show you two examples of this. We have worked with these machines before and have already made plans for them.
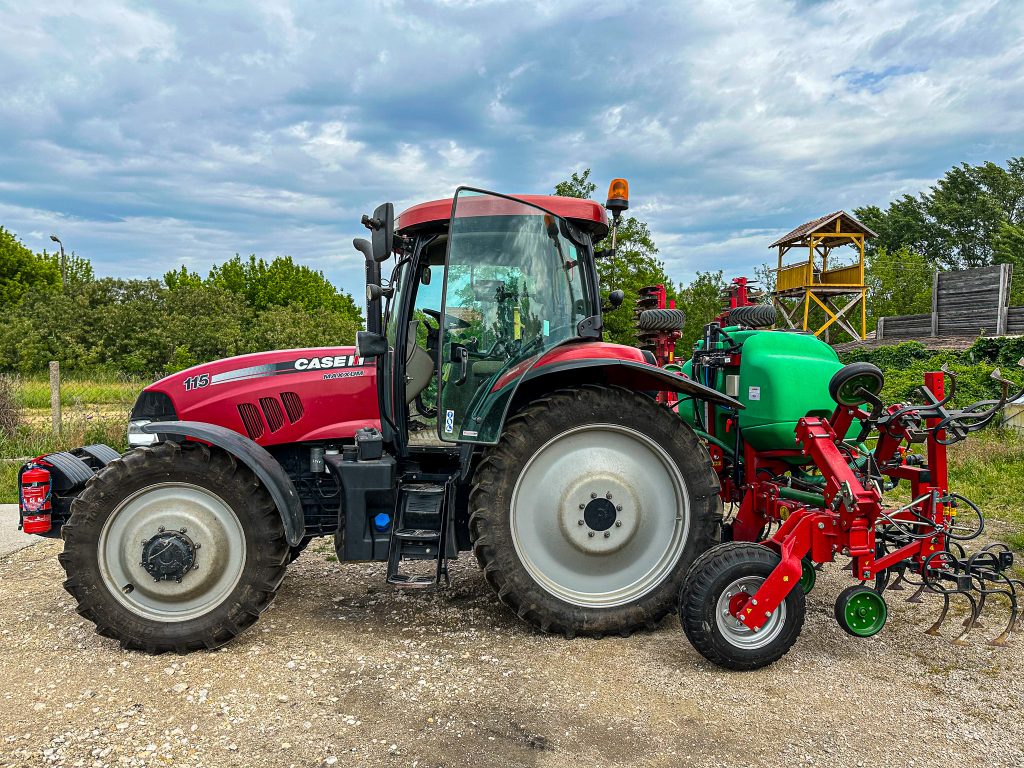
In Hungary, one of our clients upgraded his 2014 Case IH tractor with a Trimble monitor. He also upgraded a 4.5-meter liquid fertilizer injector. This did not cost a lot of money. The client saved money because he did not have to buy new machines. And it works. For this system, we designed a plan to use Variable Rate Application for his corn field.
The chart does not show this, but there was less rain during the growing season in 2024 than in 2023. The farmer grew corn in the field in both years. Measuring the yields shows that our plan for zones and application rates was correct. It also shows another important thing. The poorer zones of the field received less fertilizer. Because there was less rain, these zones had a lower yield. With a conventional method, putting fertilizer on these zones would be a waste of money. The better zones of the field received the right amount of fertilizer. Even with less rain, they still produced a good yield.
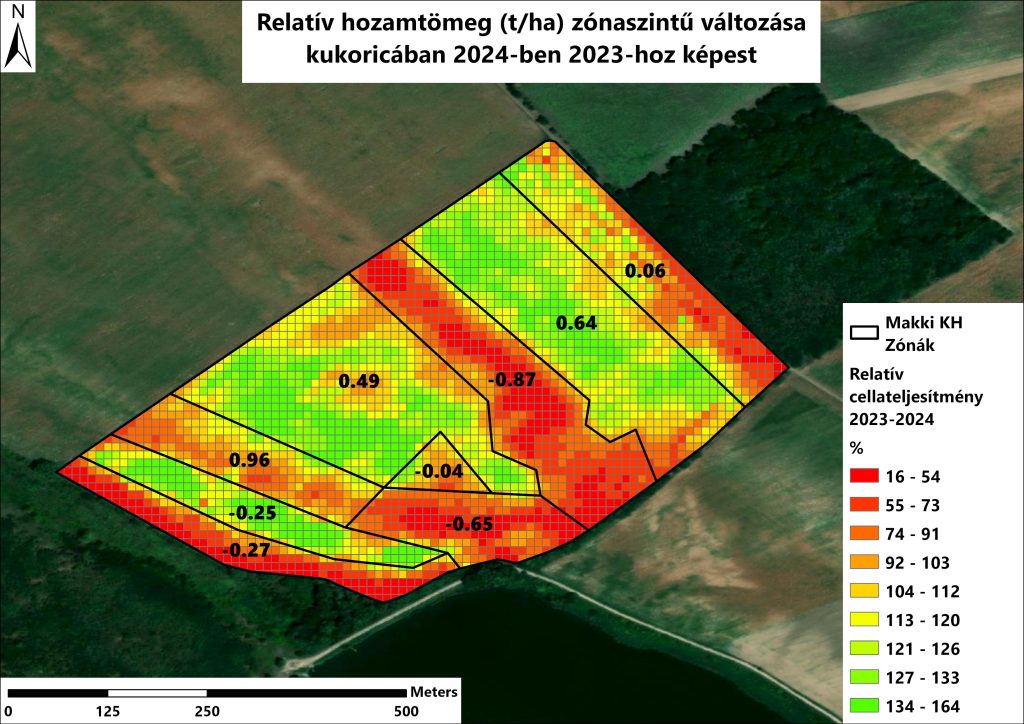
As you can see, an upgraded tractor and applicator can perform just as well as the newest machines on a large field. Efficiency does not depend on the technology. It depends on careful planning and application.
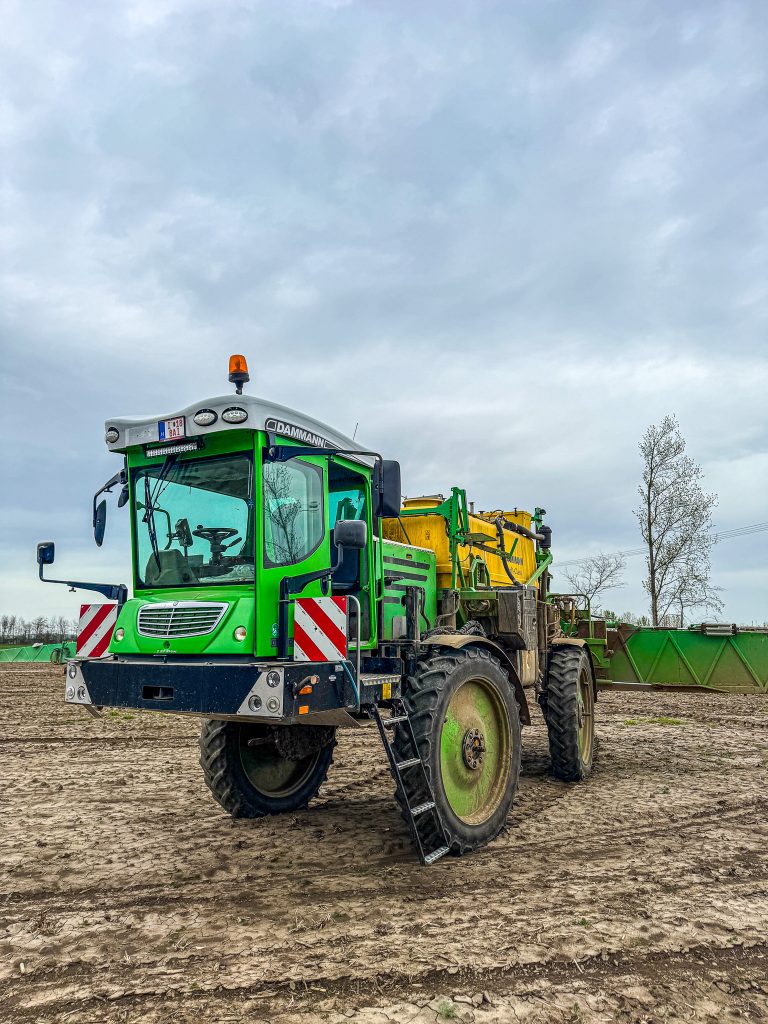
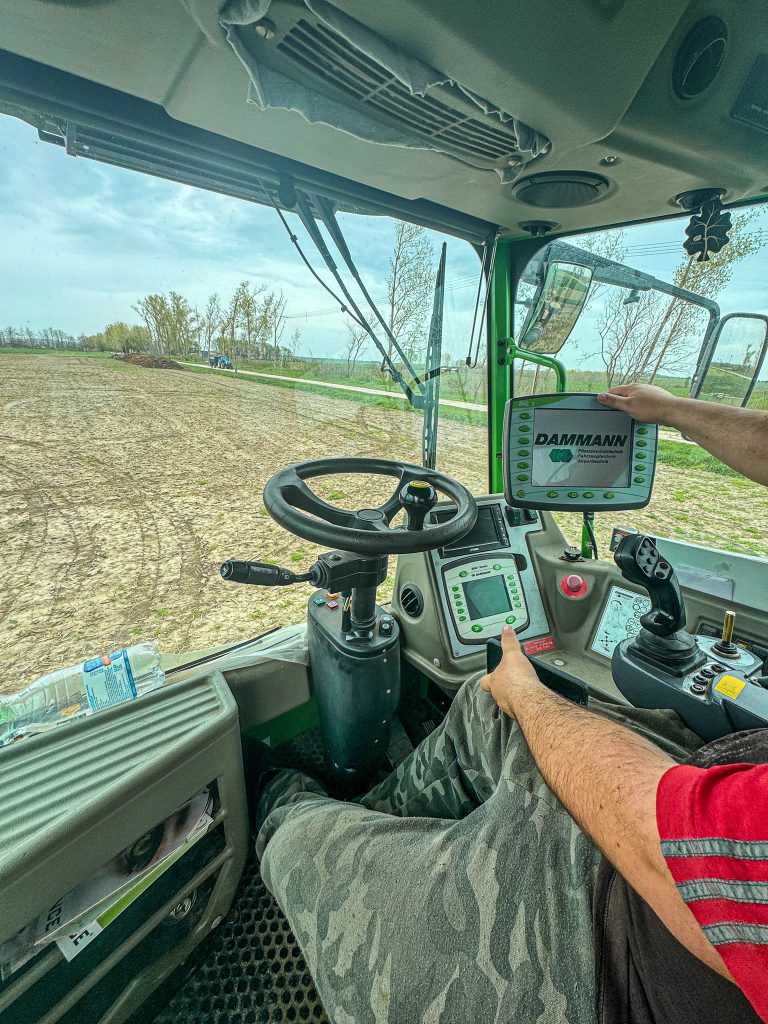
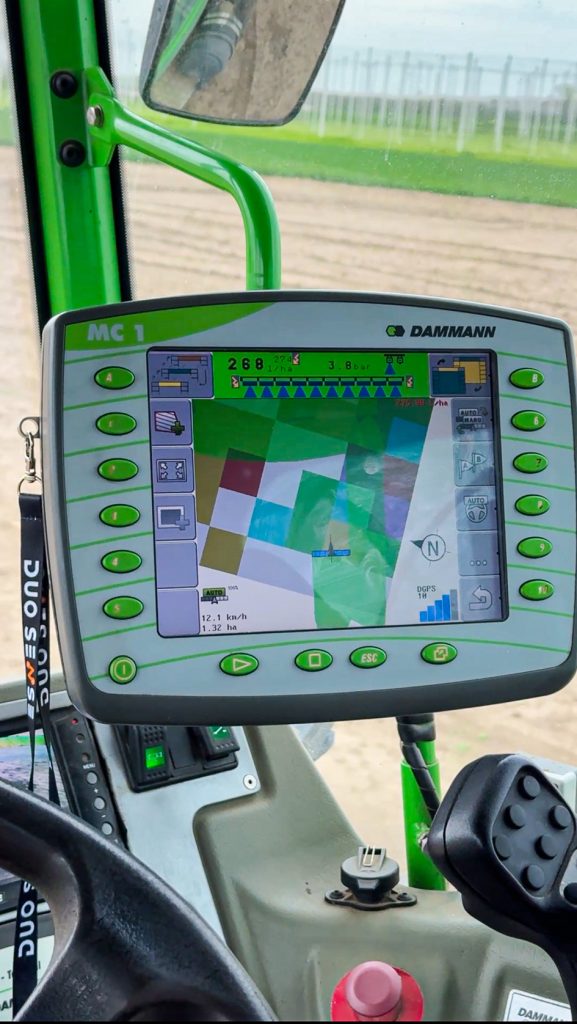
We have also worked with even older technology. In Tamási, Hungary, we worked on a Dammann self-propelled sprayer from 2008. This machine is older and slower, but it can still do Variable Rate Application.
We tested this during the machine setup. We uploaded a test map to the machine, and it followed the plan without any problems. This shows that even if a machine is old and slow, it can still be right for the job.
Myth +1: Yield maps are always accurate, and you can use them immediately to plan Variable Rate Application.
Reality: Raw yield data has errors. It is very important to process this data correctly to create good yield maps.
Yield data is the most important source of information for precision planning. With this data, we can create management zones. For these zones, we can plan the right application rates for seeds, fertilizer, and even crop protection products. However, the raw data has errors, and it must be cleaned. These errors often happen at the edges of the field, or when the machine drives over hills. This bad data can be 1–10% of all the information in a data set. This may not seem like a lot, but it can lead to bad planning. As a result, the farmer will use the wrong application rates. In the end, this can cause more harm than using a conventional method on the farm.
Data calibration is another important step. You can do this in the field by measuring the weight and grain moisture of the crop. But we can also calibrate the data later. So, if a combine harvests without on-site calibration, we can still fix the data afterwards. We only need to know the total weight of the harvested crop in each fields. Now, let’s see what these errors look like and how they can change the final plans.
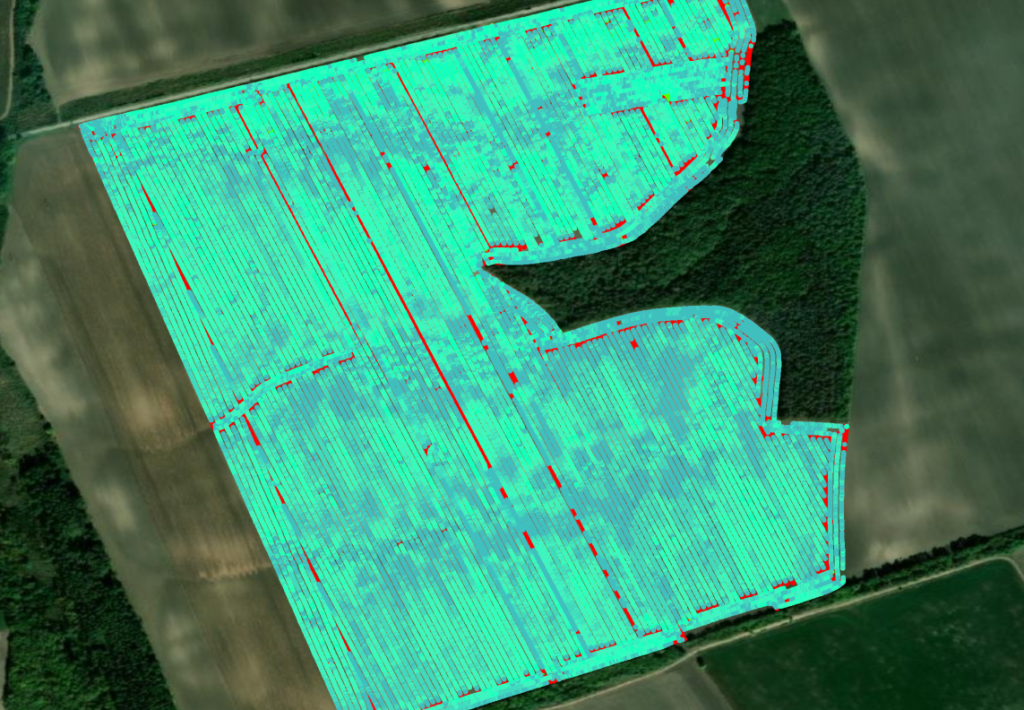
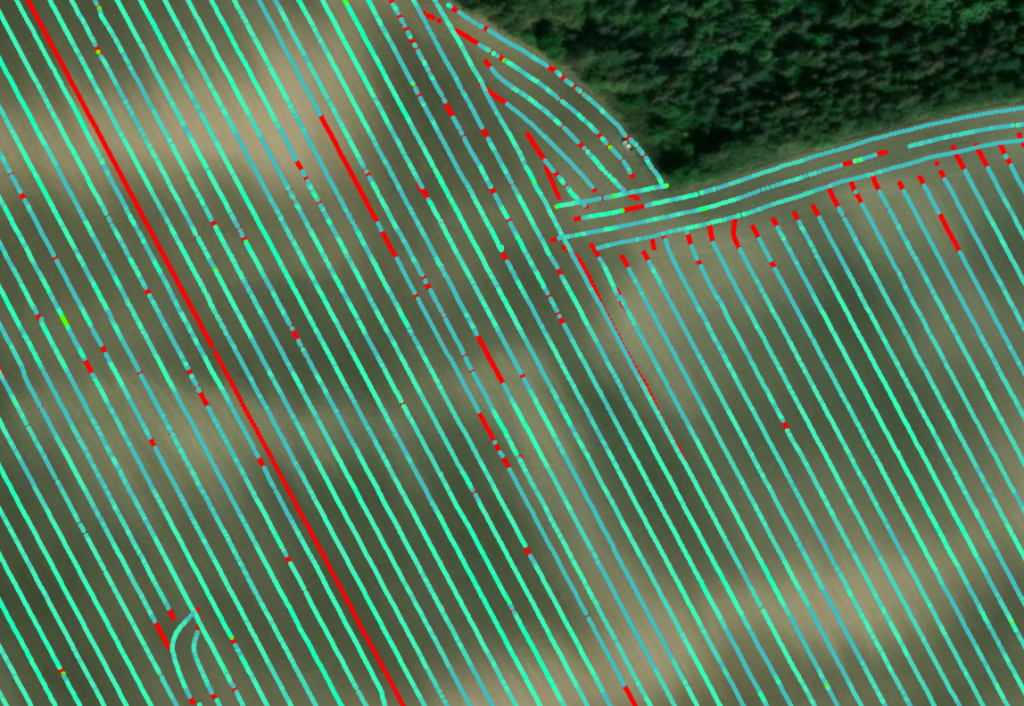
On the pictures, the light blue points are the yield data after we clean them. The layer underneath shows all the original data. We clean the data using a scientific method. This method removes bad data from places like where the machine turns, or from hilly ground. When you look closely at the second picture, you can see the difference between the good data and the bad data.
In this example, we have an 80-hectare corn field. The raw data has 98 875 points. After cleaning, 90 160 good data points are left. That is a difference of almost 9%. Again, this is not data loss. We are only keeping the true, correct data. The average yield from the raw data is 9.22 t/ha. After cleaning, the average yield is 9.67 t/ha.
We are also very careful with areas that show a yield of zero. We need to understand why the yield was zero. For example, a part of the field can have a true zero yield because of a drought or too much water. In these cases, we keep the data. But sometimes the yield is zero because of wild damage or too many weeds. We delete these points because we don’t know what the real yield of that area could be. This is why talking with the farmer is very important during data cleaning. Without good communication, our plans can be wrong. The management zones and the application rates can be incorrect, even with a scientific method.
Join us for Part 2 of “Facts and Myths about Precision Agriculture.” We will explain more myths to help you see how this technology is useful in real-life farming.
You cannot use, download, or copy any documents or data from our website without our permission. All materials on this website are protected by copyright law, and every visitor must respect these rights. Using our materials without permission is against the law.